Isothermal Titration Calorimetry

Figure 1A
Figure 1A is a representation of cells in ITC calorimeter.

Figure 1B
In Figure 1B, exothermic events are observed as negative peaks and endothermic events are observed as positive peaks.
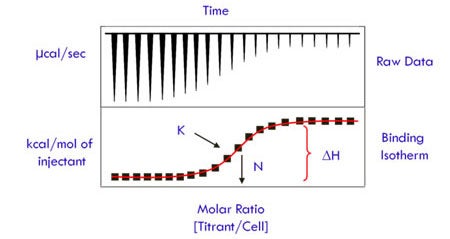
Figure 2
Figure 2 is an ideal representation of a titration with raw data depicted in the top graph and the integrated binding isotherm depicted in the bottom graph.
References
N. E. Grossoehme, A. M. Spuches, D. E. Wilcox. Application of isothermal titration calorimetry in bioinorganic chemistry. Journal of Biological Inorganic Chemistry. 15 (8), 1183-1191, 2010.